Story of a Thesis, Part 3: Growth
(This is the third installment of a multi-part post detailing my undergraduate thesis. See part one, part two, and part four.)
When faced with the challenge of exploring the real-estate transactions and land holdings of Venture Smith, I ran up against the methodological barrier of analog technology. Reading the boundary descriptions were not enough. Neither was drawing them out by hand on a piece of paper. I needed the accuracy, fluidity, and versatility of a digital environment. This challenge led me down the path towards GIS, and I introduced myself to Beverly Chomiak, a geology professor at Connecticut College who kindly let me into her computer lab and showed me the basics of the software.
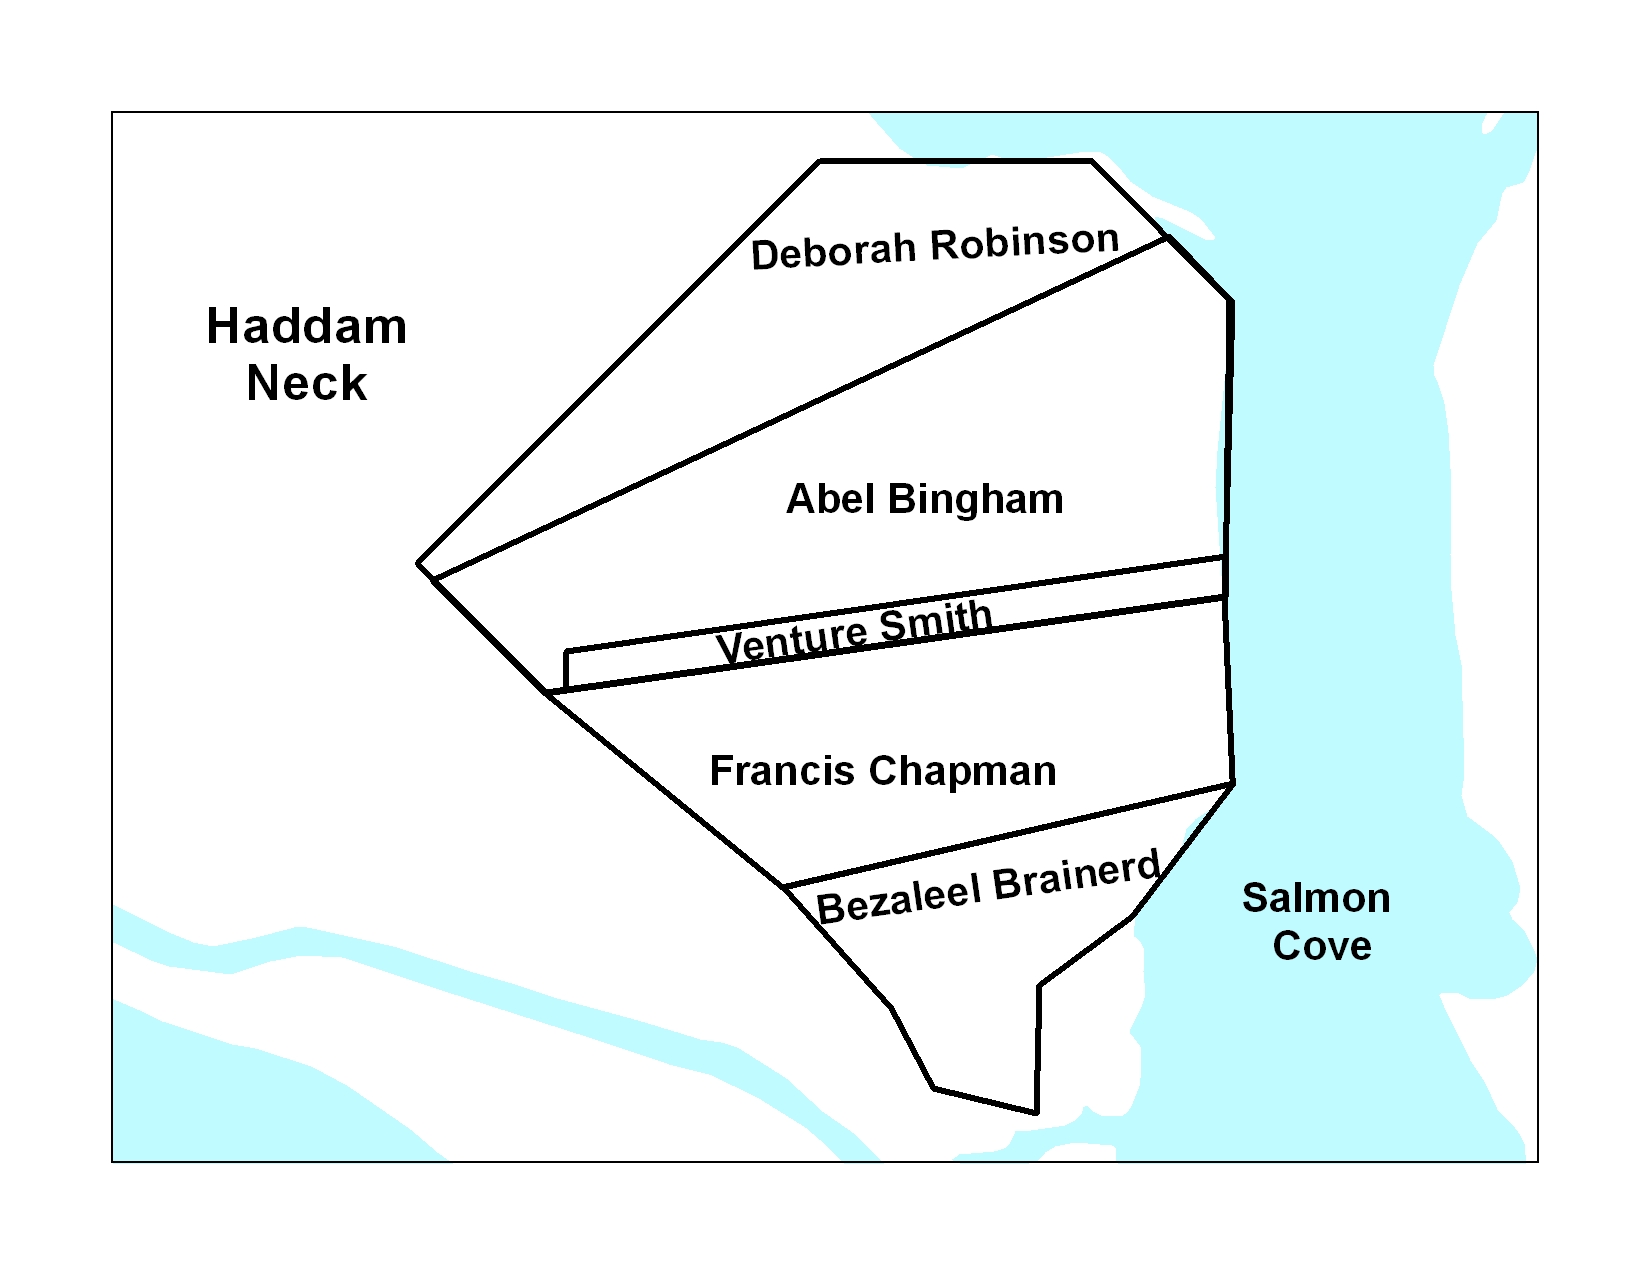
It was overwhelming at first, and the simple polygons I created in the beginning felt a lot like a student driver inching their way around an empty parking lot in a Porsche. I could literally feel the power of the software, as the computer’s hard drive frantically whirred and spun just to boot up the program. But what I was doing with it was almost comically simple. As I grew more comfortable with the interface, I began to explore, and soon hit that eureka moment of placing a series of puzzle pieces together: by creating polygons of neighboring parcels and overlaying them onto a basic map of the general area where I knew his property was located, I could place his first purchase in Haddam:
Once I had those pieces in place, I quickly learned it was a matter of finding data to add to the system. Next up was a hydrography layer, which gave phenomenally detailed information about various bodies of water across the state:
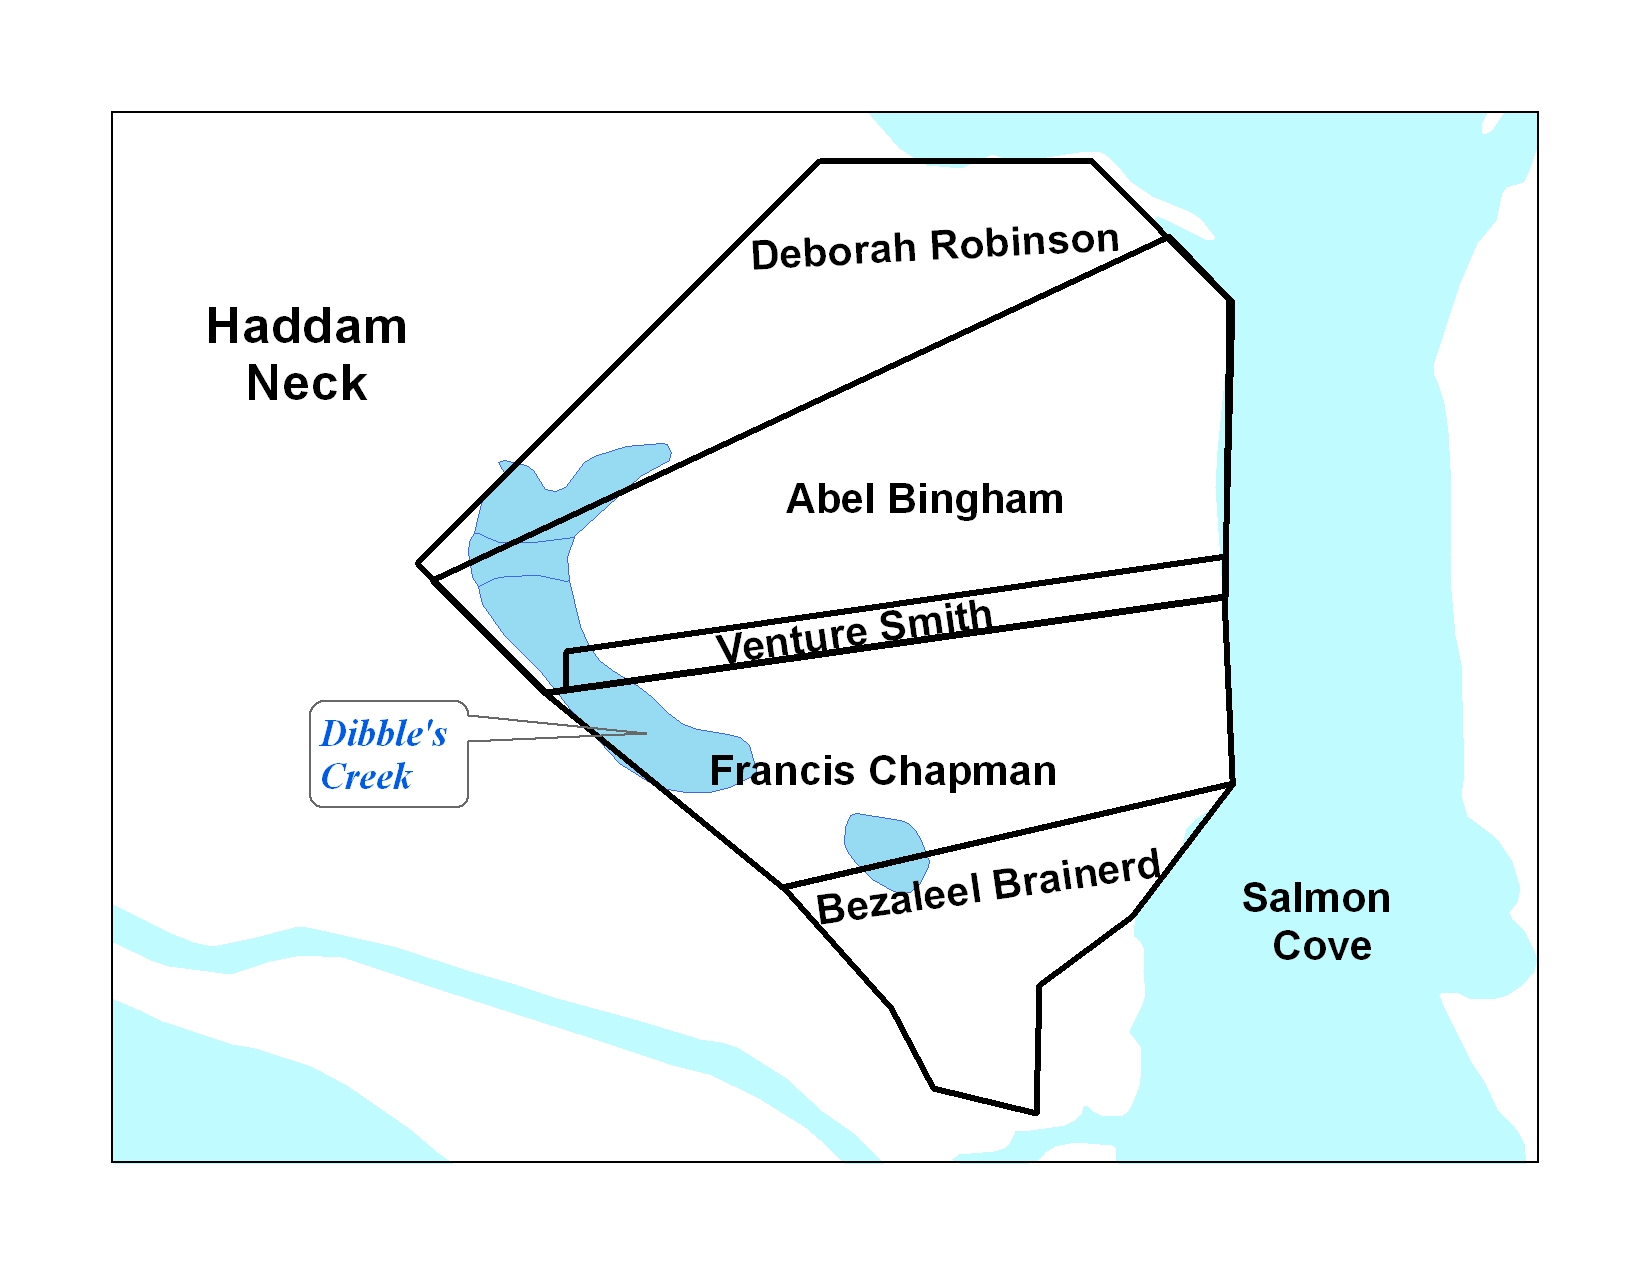
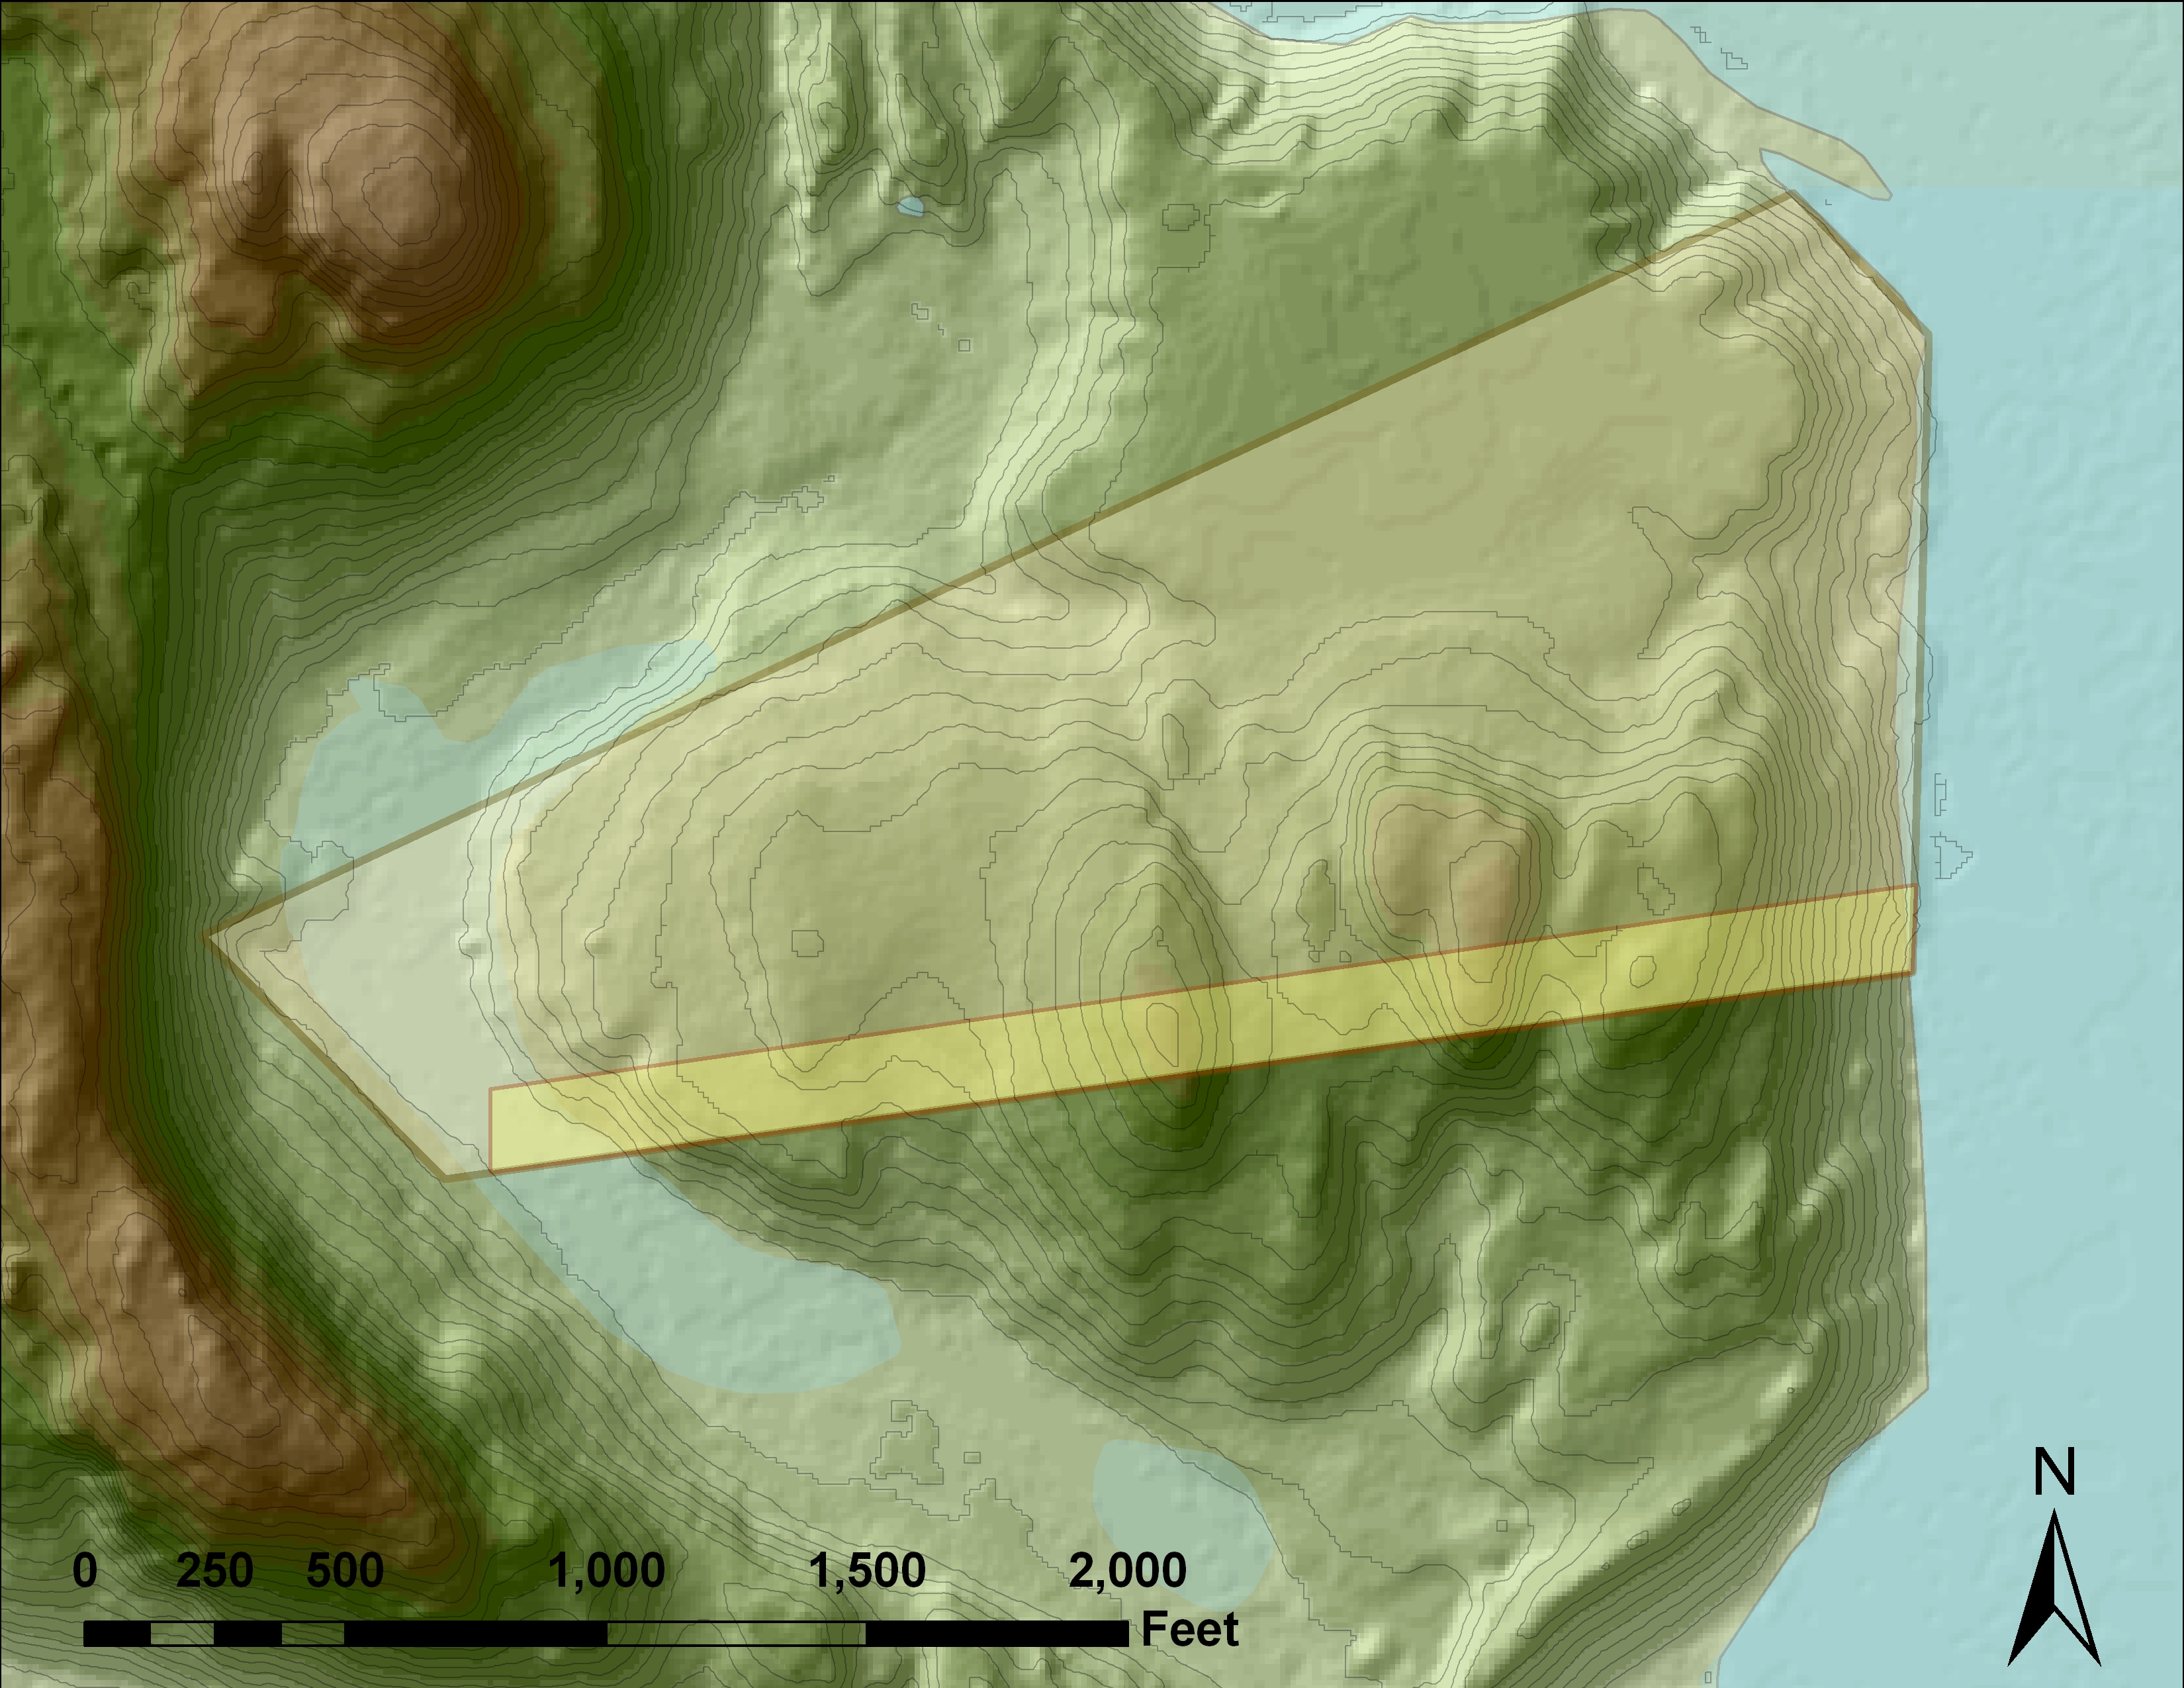
Specifically, this layer revealed something important: Venture Smith’s first purchase in the town, besides being small and narrow, had its eastern portion in a swampy marsh called Dibble’s Creek. Back at Pomona, I enlisted the generous help of Warren Roberts, GIS specialist at the Claremont Colleges’ library. He suggested I look into topography layers, and showed me how to obtain a Digital Elevation Model (DEM) for the region online. DEMs allow the user to minutely examine the elevation and slope of the land, and the regional DEM for Haddam, CT turned out to be exceedingly well-detailed:
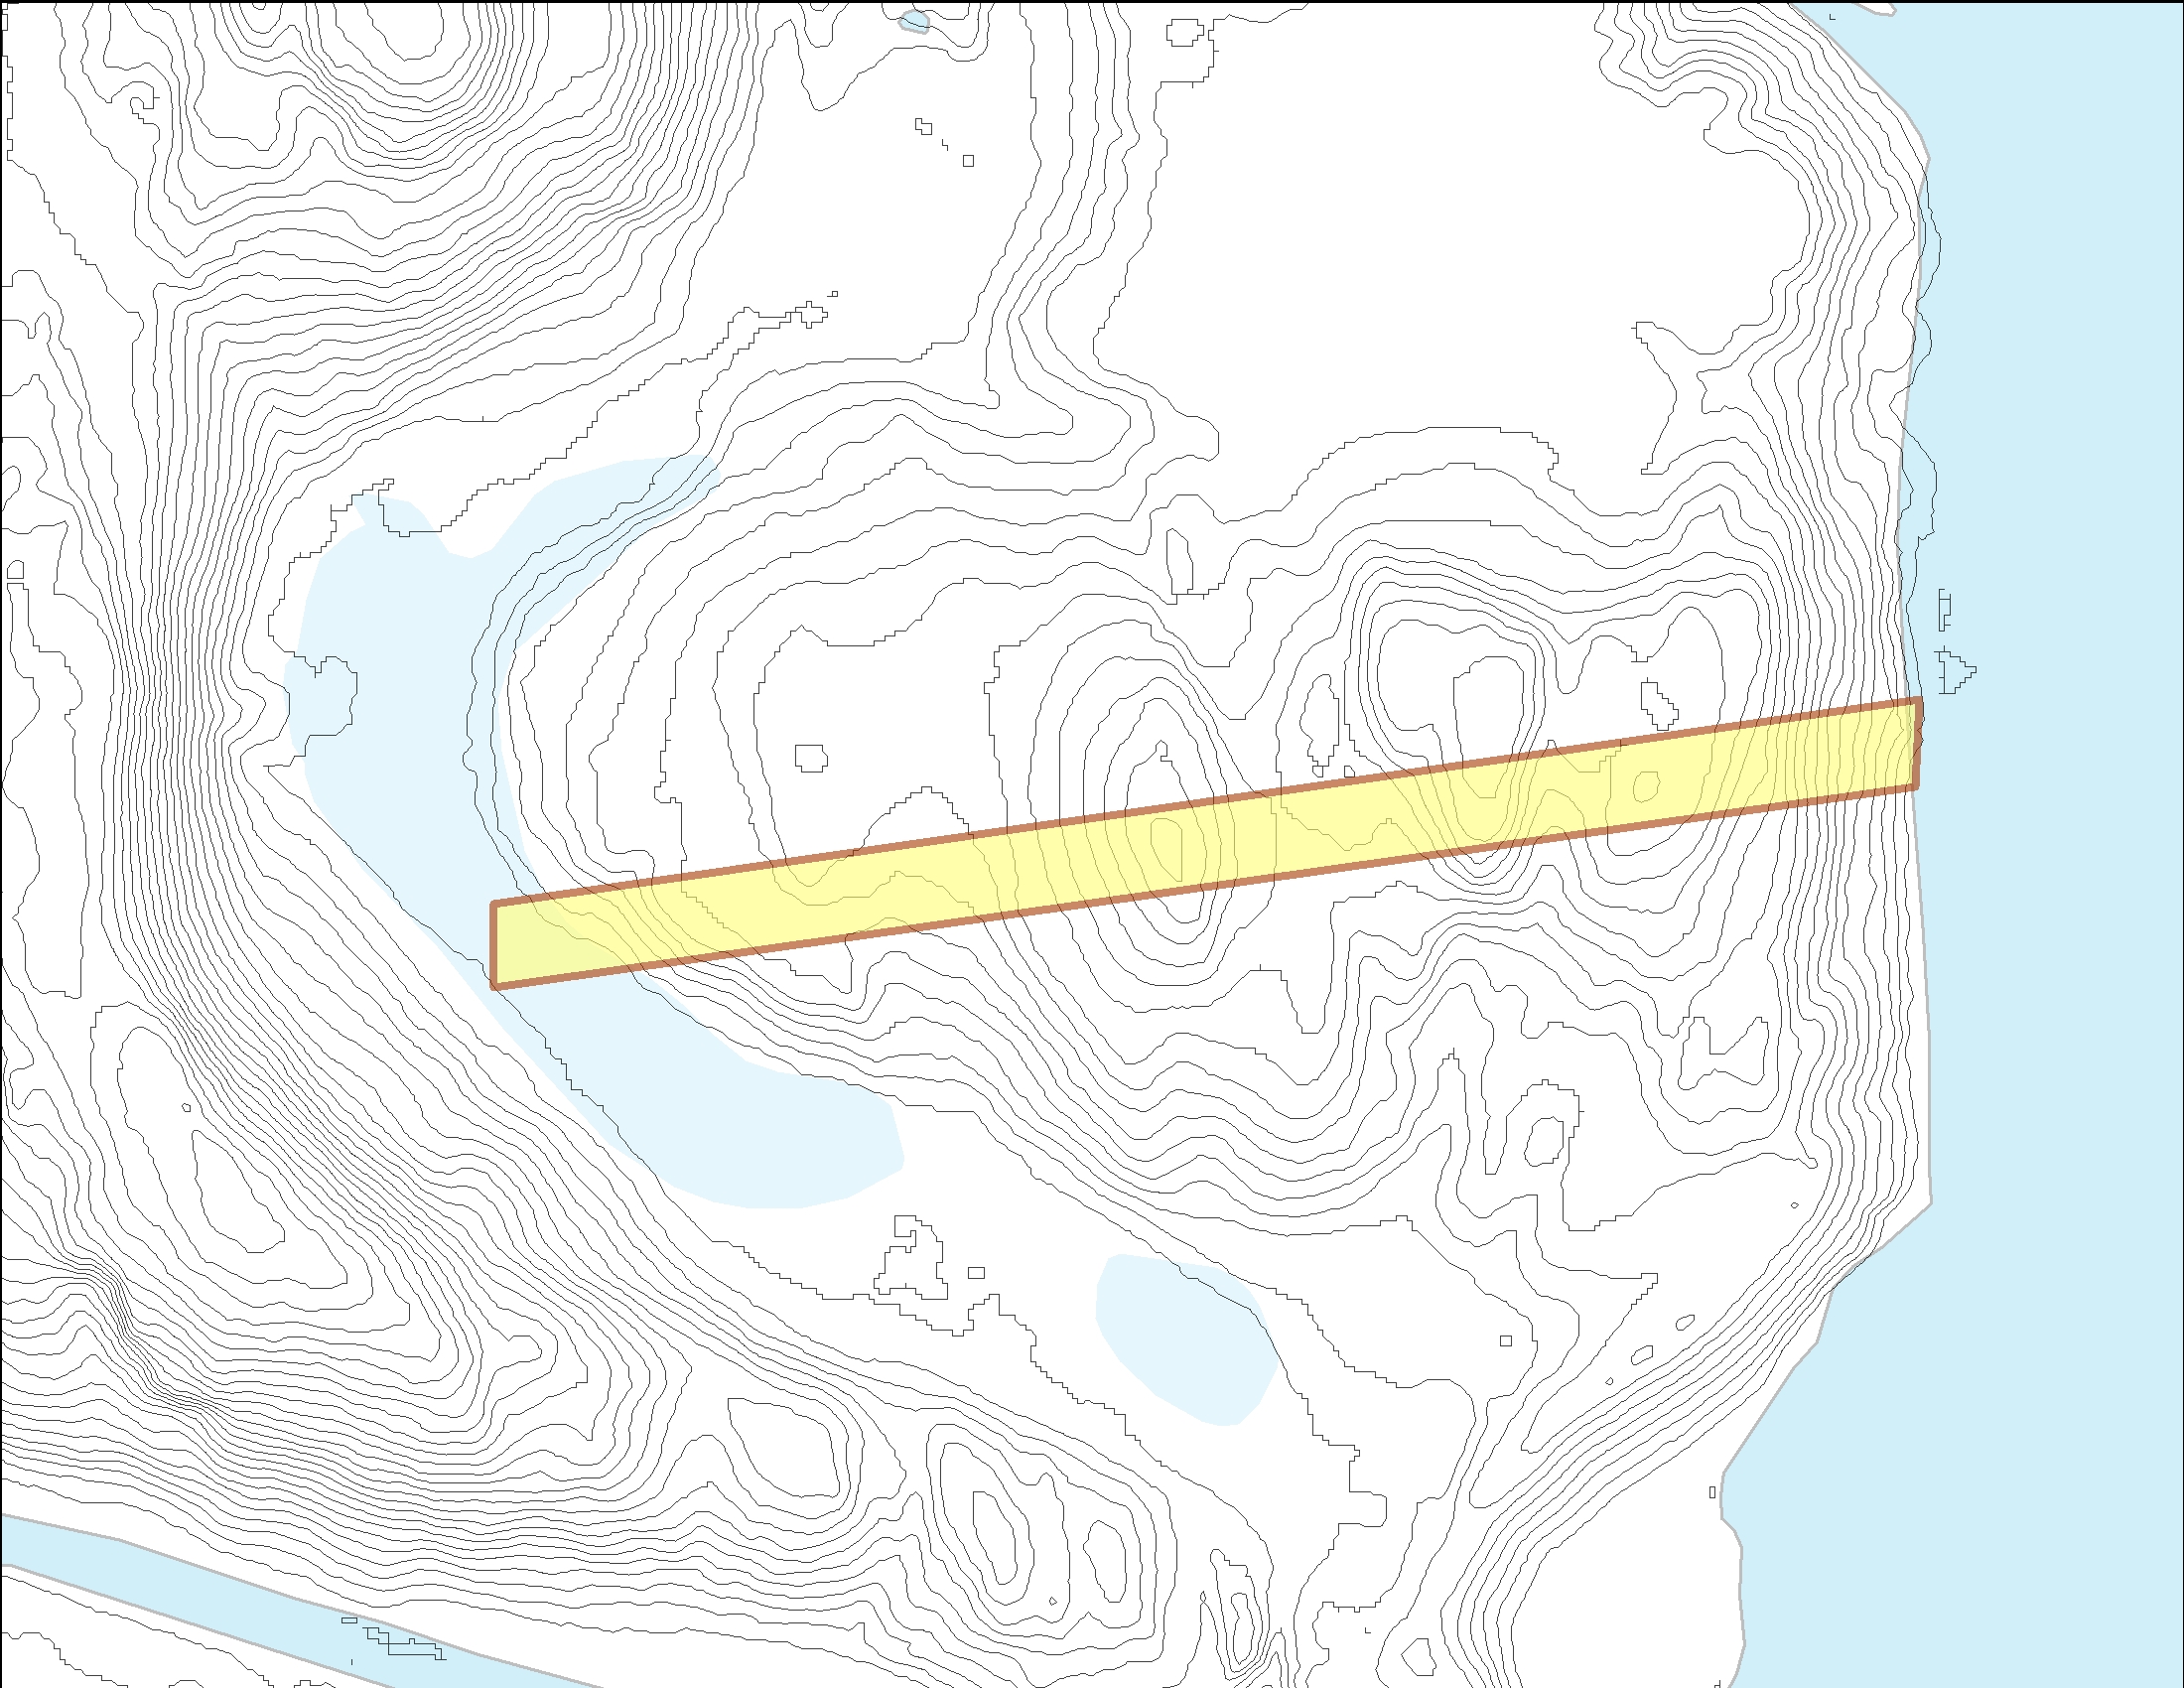
Like the hydrography layer, this additional information provided another insight into the quality of his land for that first 1775 purchase: it was incredibly hilly, especially in the eastern portion near the river. Warren also showed me how to create an elevation profile, as if one were walking from west to east across the narrow parcel:
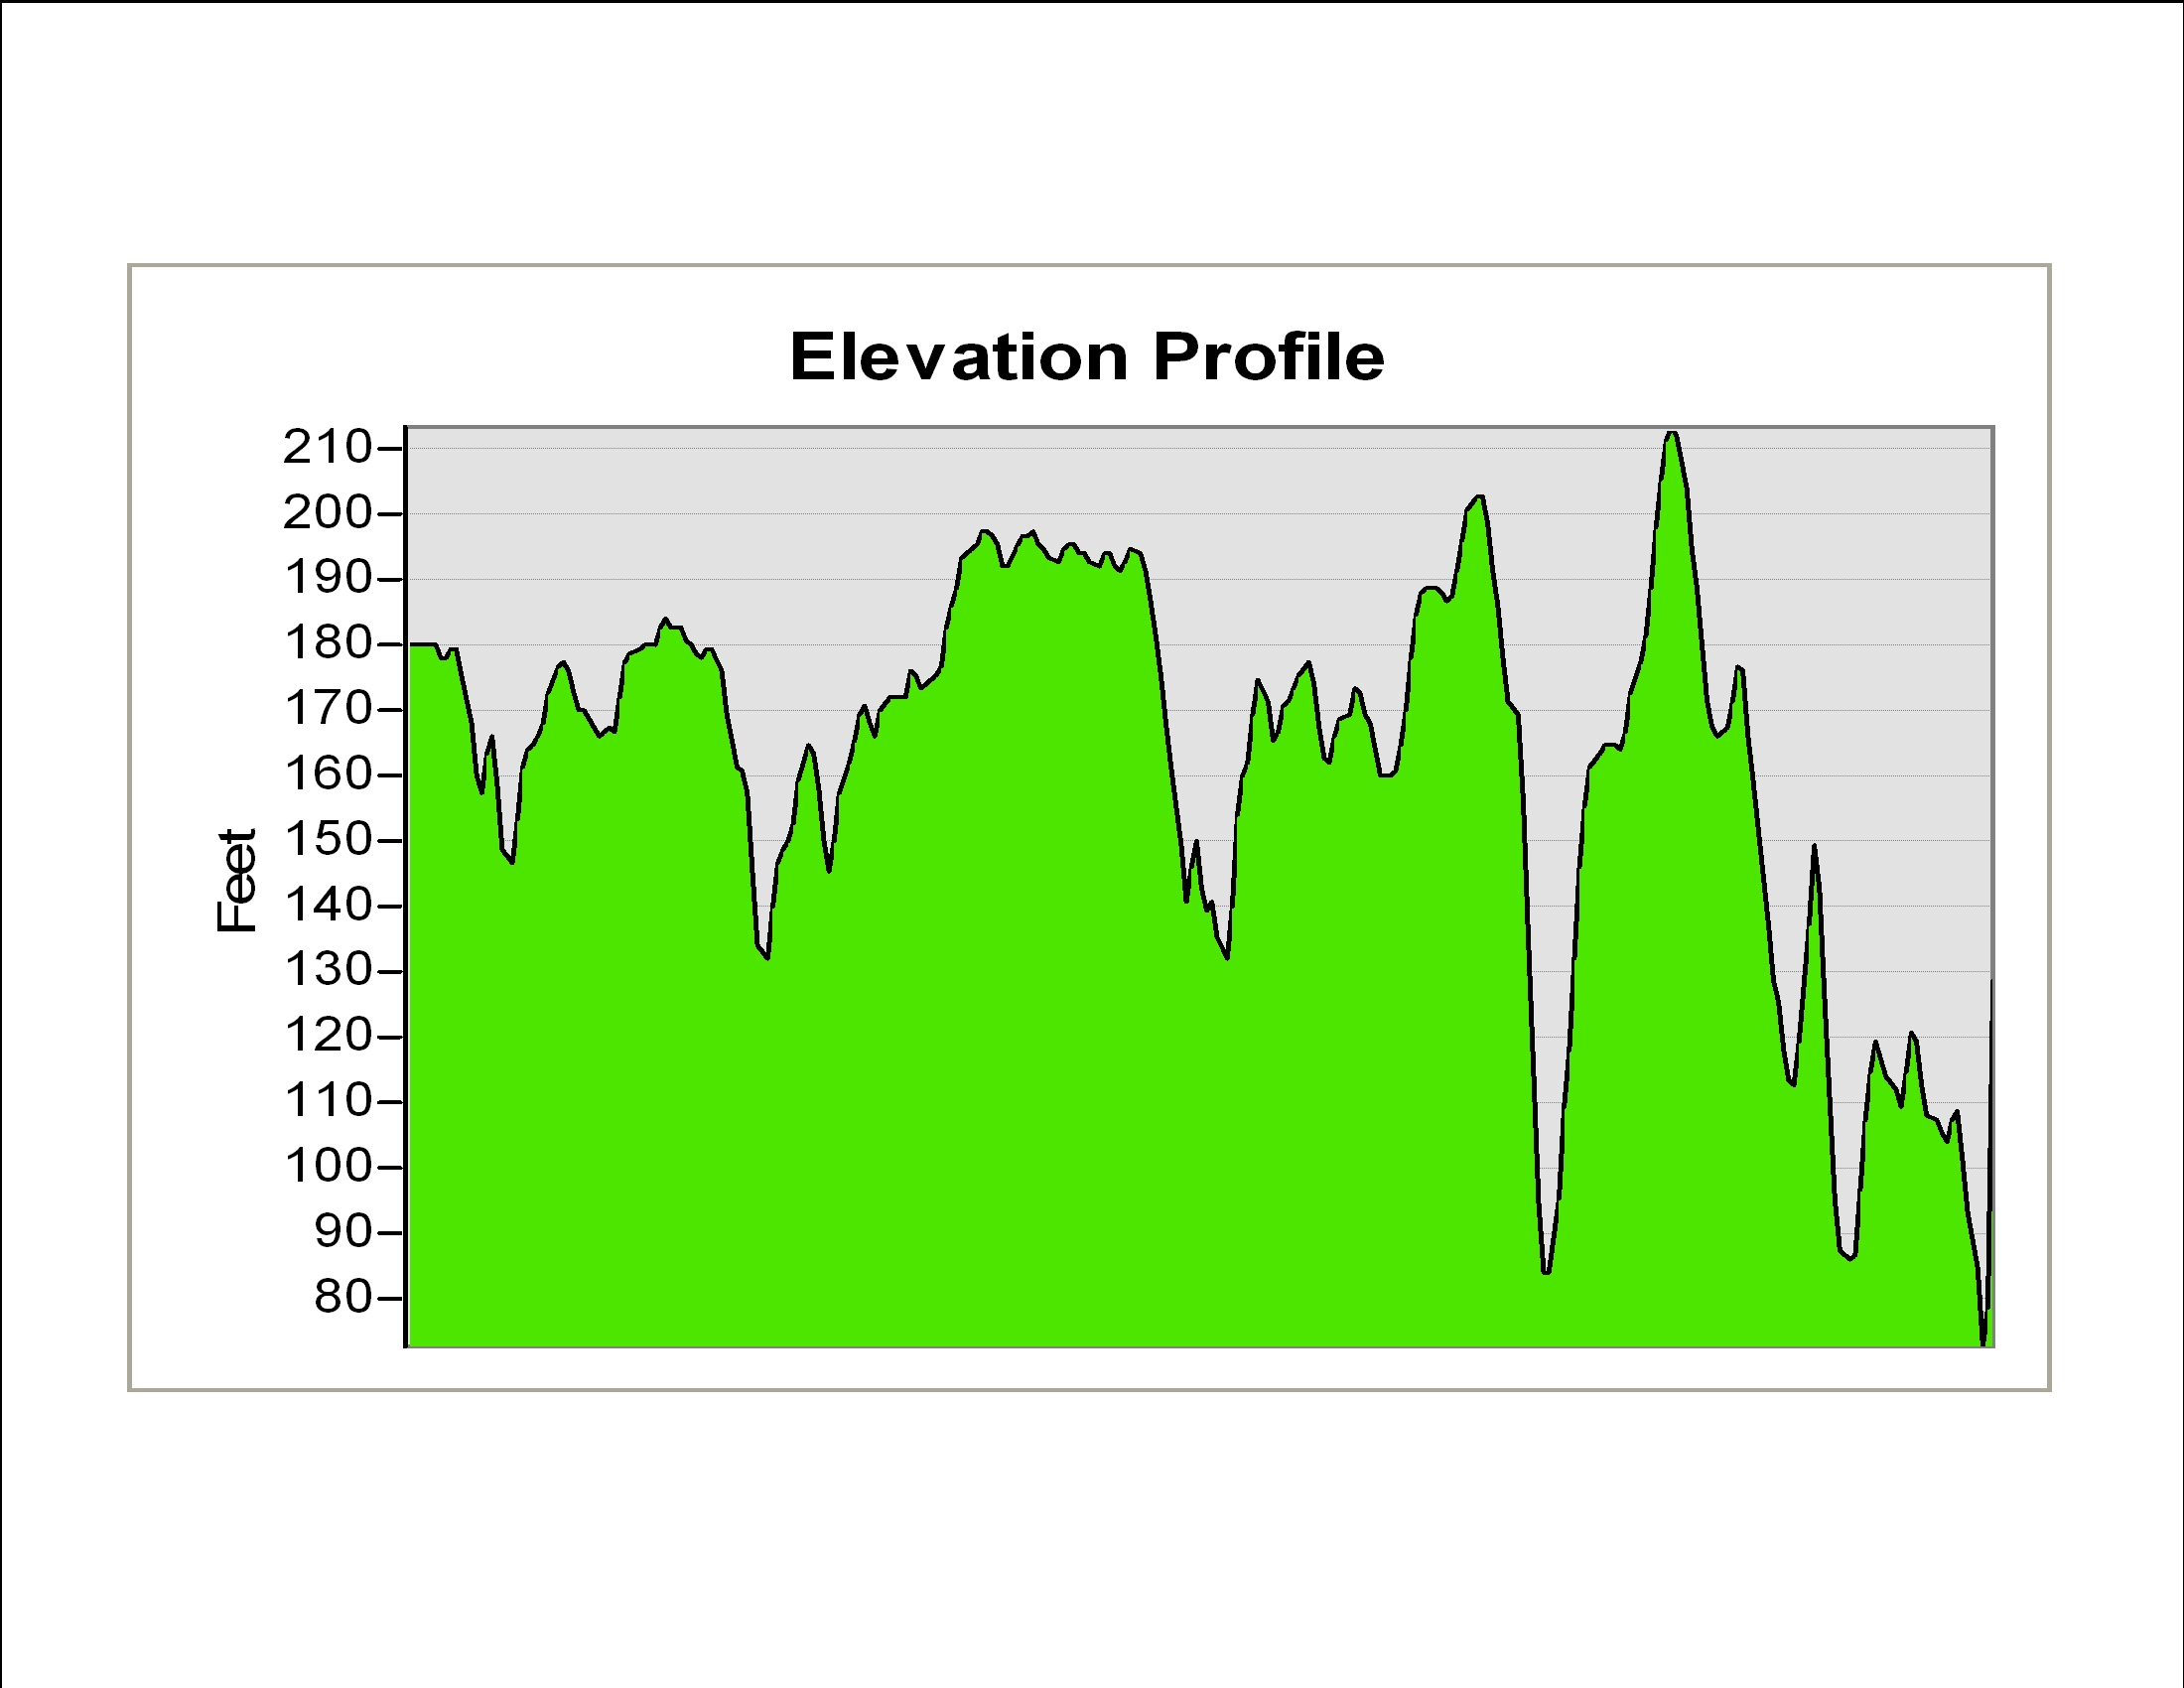
The end conclusion was that this piece of land was not particularly valuable, especially for agriculture: marshy on one end, hilly in the middle, and with a steep bank on the other side. This evidence, supported by a clause within the deed itself, pointed towards Smith using this first parcel of real estate for two purposes: as a spatial placeholder within the town, and as a base of operations for his more lucrative pursuit: cutting timber.
Warren then taught me how to use the DEM data to render a beautiful, shaded effect. Using the elevation data, GIS can create an artificial light source and “raise up” the land to create shadows and highlights. After getting in touch with my artistic background and playing around with transparency, topo lines, and color schemes, I managed to create something that I thought looked pretty good:
While I had spent countless hours examining Smith’s land, both on a computer screen and through on-site exploration, I realized that anyone reading my thesis would have only their imaginations and my flat, two-dimensional maps with which to recreate his property holdings. Fortunately, the seemingly limitless toolkit of GIS allowed me build a 3-D tour of the land through the ever-handy DEM data:
[youtube=http://www.youtube.com/watch?v=iL28FO5WWcQ]
Beyond creating pretty pictures of Smith’s first two property transactions that I could later use as a visual supplement, GIS allowed for in-depth historical analysis of Venture Smith’s real estate. Without this tool, I would have no idea what his first ten-acre purchase actually consisted of. Instead, I knew that it was poor land, and with this knowledge, the technology gave me a glimpse into the motivations and perspective of the middle-aged Smith during those first two years in Haddam. It allowed me to recreate his experience: cutting wood on the side of a hill, moving his timber down the steep embankment and onto the cart path mentioned in the deed, and stockpiling it for transport downriver to a town market center. Using GIS, I knew that these first years were more precarious than Smith let on in his narrative. He faced the daunting prospect of providing for a wife and children, one of whom was a newborn, moving to a new town as black outsiders, and settling onto a narrow strip of land with little to no value. All of this occurred against the backdrop of a quickly-erupting war between the colonies and Great Britain. Armed with the toolkit of GIS and peering through the lens of property and land, I was ready to construct my own narrative of Venture Smith’s life as a free man.